Thursday, March 27, 2014

A preview of the next global crisis

Investors dodged another bullet recently as geopolitical instability temporarily subsided after Russia’s annexation of Crimea.  Although U.S. equities have experienced an internal correction since then, most of the damage has been relegated to over-extended tech stocks that were in need of a pullback. 

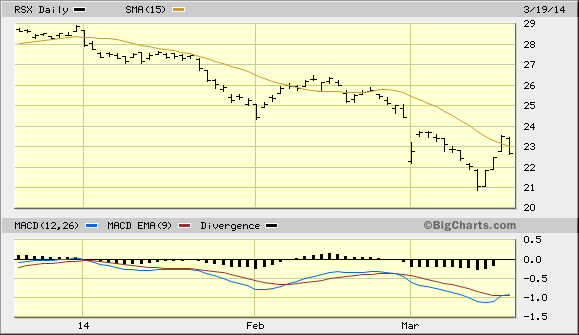
A reflection of the recent lifting of selling pressure on Russian equities can be seen in the daily chart for the Market Vectors Russia ETF (RSX), a proxy for Russia’s stock market.  RSX has rallied 10 percent off its year-to-date low and is now above the 15-day moving average to signal at least a temporary break of the immediate-term downtrend. 


Wall Street’s concern with China’s slowing economy has also diminished from earlier this month and is reflected in the 4 percent rally of the Shanghai Composite Index recently.  With China, Russia and the emerging markets on the backburner, equity investors should enjoy a temporary respite of worries until at least later this spring.  While U.S. stocks are under mild selling pressure right now, the fact that the S&P 500 Index (SPX) is hovering close to its highs despite the correction in growth stocks suggests that the bulls haven’t yet given up their control over the market.  A “spring fling” to new highs can’t be ruled out before the final descent of the long-term deflationary cycle makes its presence known.

Maybe not in the next couple of months, but certainly by the summer we should see signs of increasing market volatility and accelerating selling pressure, especially as we head closer to the final bottom of the 60-year deflationary cycle this fall.  If China and/or other emerging market countries are experiencing turmoil at that time, it will only serve to exacerbate the volatility. 

Speaking of China, it’s worth noting that Goldman Sachs Group has warned that financing arrangements in China using commodities to obtain credit may unwind in the next 12 to 24 months.  The unwinding would likely be driven by increased volatility in the yuan currency, according to Goldman.  The unwinding would be bearish “given relatively limited physical liquidity to absorb the shock,” Goldman’s chief commodities analyst Jeffrey Currie wrote. 

Already we’ve seen preliminary signs of what the next global market crisis could look like.  The problems have originated in China and Russia with other countries (e.g. Brazil, Chile, Turkey) playing supporting roles.  This is very similar to what happened in 1998 with the financial crisis that rolled across the globe beginning with Asia and extending to South America, Russia and finally hitting the U.S. like a tsunami.  Few market analysts in 1998 (a super boom year) believed the “Asian contagion” would infect U.S. markets, but they were dead wrong.  It happened very quickly in ’98 with most of the damage occurring in July through September – the final “hard down” phase of the 4-year and 8-year cycles.  Not coincidentally, 2014 is also a bottom year for the 4/8-year cycles as well as several others.

Contrary to Wall Street’s expectations, global market volatility is still a prime consideration for stocks in the intermediate-term.  China’s slowing economy may come to exert a significant drag on global equities as the year progresses, and Russia will remain the proverbial powder keg until the Ukraine situation has been fully resolved.  Until then, investors are advised to fasten their seatbelts as there will likely be increasing turbulence this summer.

Again, this summer the 4-year, 8-year, 10-year, 12-year, etc. cycles through the 60-year cycle will also be cascading into their final bottoms around late September/early October.  It would be surprising indeed if the financial market somehow emerged unscathed by this crescendo, especially given the fragile state of the global economy.

Wednesday, March 26, 2014

Treasury bonds reflect global deflationary pressure

....Also worth noting is the latest action in the bond market.  In the Feb. 26 report we discussed buy signal for bonds confirmed by the Coppock Curve indicator for the iShares 20+ Year Treasury Bond ETF (TLT).  

The Coppock Curve is one of the single best indicators for issuing buy signals on bonds (though it is less helpful for determining tops).  The Coppock Curve is derived by adding the 14-month and 11-month rate of changes for bond prices and smoothing the result with a 10-month weighted moving average. 

As I wrote in the Feb. 26 report: “The recent Coppock Curve buy signal for bonds, assuming it pans out, means that Treasury yields will be declining while bond prices rise.  Declining yields are very much consistent with the Kress cycle scenario for 2014, which suggests that disinflationary if not outright deflationary pressures will increase until the long-term cycles bottom later this year.”  


While I don’t expect selling pressure to be very strong against equities until after May, the fact that TLT broke out above an 8-month trading range ceiling on Wednesday is an indication that investors are becoming more concerned about deflation and its effects on global market volatility.

[Excerpted from the Mar. 26 issue of Momentum Strategies Report]

Friday, March 21, 2014

China, Russia still presents a risk for investors

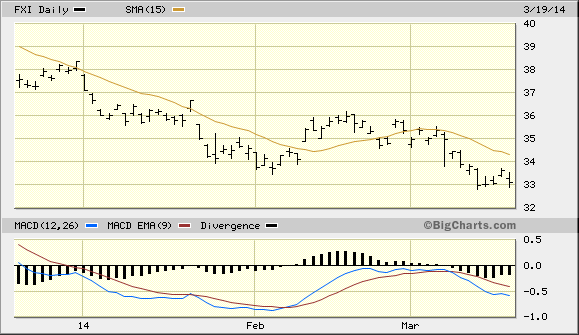
The following graph of the iShares China Large-Cap ETF (FXI), our favorite proxy for China’s stock market, is still hanging on by a thread above its recent lows.  A close decisively beneath the 33.00 level for FXI would likely roil global stock markets just as the previous decline in FXI did in January.  It will be well worth keeping an eye on FXI in the upcoming days.


Speaking of China, it’s worth noting that Goldman Sachs Group has warned that financing arrangements in China using commodities to obtain credit may unwind in the next 12 to 24 months.  The unwinding would likely be driven by increased volatility in the yuan currency, according to Goldman.  The unwinding would be bearish “given relatively limited physical liquidity to absorb the shock,” Goldman’s chief commodities analyst Jeffrey Currie wrote. 

It will also be important to monitor the Russia ETF (RSX) in the period between now and April 4.  As you can see here, RSX (our Russia proxy) still hasn’t confirmed an immediate-term bottom as it hasn’t yet closed two days higher above its 15-day moving average.  RSX was down 3.53% on Wednesday as the initial euphoria over the past weekend’s Crimea vote subsides. 


Contrary to Wall Street’s expectations, global market volatility is still a prime consideration for stocks in the intermediate-term.  China’s slowing economy may come to exert a significant drag on global equities as the year progresses, and Russia will remain the proverbial powder keg until the Crimean situation has been fully resolved.  Until then, investors are advised to fasten their seatbelts as there will likely be increasing turbulence in the coming months. 

[Excerpted from the Mar. 19 issue of MomentumStrategies Report]

Monday, March 17, 2014

The dangers of the 4-year presidential cycle

Even if you’re not a proponent of Kress cycle theory, consider that we’re in the second year of the 4-year presidential cycle.  The second year following a U.S. presidential election year is almost always marked by increased market volatility…. 

….Maybe not in the next couple of months, but certainly by the summer we should see signs of increasing market volatility and accelerating selling pressure, especially as we head closer to the final bottom of the 60-year deflationary cycle this fall.  If China and/or other emerging market countries are experiencing turmoil (as I expect) it will likely only serve to exacerbate the volatility. 

Already we’re seeing preliminary signs of what the next global market crisis could look like.  The problems have originated in China and Russia with other countries (e.g. Brazil, Chile, Turkey) playing supporting roles.  This is very similar to what happened in 1998 with the financial crisis that rolled across the globe beginning with Asia and extending to South America, Russia and finally hitting the U.S. like a tsunami.  Few market analysts in 1998 (a super boom year) believed the “Asian contagion” would infect U.S. markets, but they were dead wrong.  It happened very quickly in ’98 with most of the damage occurring in July through September – the final “hard down” phase of the 4-year and 8-year cycles. 

Again, this summer the 4-year, 8-year, 10-year, 12-year, etc. cycles through the 60-year cycle will also be cascading into their final bottoms around late September/early October.  It would be surprising indeed if the financial market somehow emerged unscathed by this crescendo, especially given the fragile state of the global economy.

[Excerpted from the Mar. 14 issue of Momentum Strategies Report]

Friday, March 14, 2014

Bearish banks help fuel gold’s meteoric run

Just when you thought the last of the big institutional banks were ready to throw in the towel on their bearish metal forecasts, yet another one has joined the ranks of the gold bears. 
 
Morgan Stanley was the latest to enter the fray on Monday when it lowered its gold price forecast for 2014 and 2015 in a research report.  The group based its lower forecast on the expected impact of reduced monetary stimulus combined with increased regulatory pressure on investment banks to reduce the scale of proprietary commodities trading.
 
Morgan noted that while demand for physical gold remained strong in China, imports to India were low.  Moreover, Morgan asserted that last year’s sell-off of assets by gold ETFs nullified the strength provided by increased Chinese demand.  “The lower price environment will pose significant challenges for gold miners given the substantial rise in costs over the past decade,” the bank said.
 
Morgan Stanley lowered its 2014 average price forecast for gold by 11.6 percent to $1,160/oz, and cut its average 2015 gold price forecast by 12.5 percent to $1,138/oz.
 
Let’s examine the two basic assumptions behind Morgan Stanley’s bearish gold forecast for 2014-2015.  The first negative assumption is that reduced monetary stimulus will result in lower gold prices.  We’ve already discovered in previous reports the fallacy of this argument.  Indeed, ever since the U.S. Federal Reserve announced that it be tapering its asset purchases the gold price has gone up in contrast to what most institutional analysts predicted.  This is because quantitative easing (QE) isn’t a major driver for the gold price; volatility and investor uncertainty are the main drivers. 
 
In the final portion of the deflationary long wave, fear and uncertainty are the main reasons for owning gold.  As long as investor trepidation remains, any increase in economic fragility or geopolitical tension (e.g. China, Russia, Ukraine) will only serve to underscore gold’s attractiveness as a financial save haven.  In just the last two-and-half months we’ve seen how a stock market correction, an emerging markets scare, military tensions in Eastern Europe, and economic uncertainty in China have combined to lift the yellow metal to its highest levels since last September.  All the while the Fed has been reducing the pace of its mortgage purchases and otherwise shrinking its QE policy. 
 
If anything, reducing the pace of QE has helped rather than hindered the gold price.  We could speculate the reason for this as being that investors are perhaps apprehensive about the stability of the economic recovery in the face of a tightening central bank money stance.  Regardless of the actual rationale, gold investors have no problem with tighter monetary policy, thus undermining the primary basis for Morgan’s bearish gold forecast.
 
Morgan Stanley’s second reason for embracing a bearish 2014-15 gold outlook are the new rules restricting proprietary commodities trading among investment banks.  Yet even before these rules were implemented banks had already begun shrinking their commodity trading desks.  Indeed, bank trading is no longer even a central pillar behind gold price momentum and hasn’t been for a long time.  This, then, is also a deceptive reason for expecting gold to underperform in the coming 1-2 years. 
 
With the gold price having rallied some 15 percent off last year’s lows, the leading institutional banks are wiping a lot of egg off their faces.  Goldman Sachs, arguably the most respectable of the big Wall Street banks, is bending over backwards of late in making excuses for its blown gold call from late last year.  In its latest report to its clients, Goldman asserts its continued belief that the gold rally will soon fade despite renewed buying among hedge funds. 
 
According to U.S. government data, hedge funds and other speculators increased bullish bets on gold for a fourth consecutive week and are currently the most bullish they’ve been since December 2012.  The net-long position in gold climbed 3.8 percent to 118,241 futures and options in the week ended March 4, according to the Commodity Futures Trading Commission (CFTC).  Short holdings, by contrast, were down 15 percent to 26,321, the lowest since October.  
 
Goldman’s chief commodities analyst, Jeffrey Currie, said that turmoil between Russia and Ukraine doesn’t alter the firm’s bearish view on gold.  He also told Bloomberg that lower mining costs means that it’s “more probable than it was six months ago that prices would drop below $1,000.”  Goldman seems to be grasping at straws in its attempt at rationalizing a blown bearish call.  Moreover, the firm believes a strengthening dollar will weigh against the metals based on the expectation of accelerating U.S. economic strength.  Yet the dollar has shown no sign of strengthening as yet but instead continues to grind lower and is testing a major low.
 
In contrast to Goldman and the Wall Street banks, billionaire hedge-fund manager John Paulson, who holds the biggest stake in SPDR Gold Trust (GLD), reported gains in his firm’s bullish gold strategies last month.  Holdings through gold ETFs rose in February for the first time since 2012.  Assets in the GLD, world’s largest gold ETF, are up 0.9 percent in 2014 following a 41 drop drop in 2013 that resulted in a $41.8 billion decline in value.

Thursday, March 13, 2014

The implication of copper's decline

Question: Why should we be concerned about the recent copper price decline when copper went down for years in the late 1990s?

Answer: Most of copper's losses in the '90s were in the economically soft early part of the decade and again during '97-'98.  You’ll recall that the Asian currency crisis beginning in ‘97 was part of the problem since overseas copper demand was impacted by this.  By 1998, the Asian (and Russian) chickens came home to roost in the U.S. and we had that nasty mini-deflationary commodities collapse (or near collapse) in the summer of ‘98 along with the shortest equities bear market on record (22% in two months if memory serves).  


It may take a few more months, but I suspect we'll eventually see China/Russia's troubled waters rippling our way – just as they did in ‘98.

Tuesday, March 11, 2014

Dr. Copper's bearish message for China

The price of copper demands our attention right now, especially given its historical ability to predict strength or weakness in the global economy.  Not surprisingly, Dr. Copper is particularly sensitive to the vagaries of China’s economy since China is its number one customer. Copper was 1.6% lower on Monday.  This followed an even bigger sell-off last Friday following news that China saw its first official corporate bond default, with Shanhai Chaori Solar Energy unable to pay its debt in full.


In Friday’s report I mentioned that the immediate trend for China stocks was still unsettled and that a move to new lows would likely be a cause for increased anxiety on Wall Street.  The Shanghai Composite Index chart shown below certainly provides a cause for this concern; as you can see the index is just barely above its previous low from mid January.  It won’t take much for this interim low to be violated, and if it happens it will undoubtedly be accompanied by great fanfare in the financial press.  This in turn could lead to spill-over selling pressure in the U.S. stock market….


China isn’t the only concern for stocks between now and the first week of April.  Russia’s geopolitical problems with Kiev could come to a head once again between now and then.  Keeping an eye on the Russia ETF (RSX) will be a prudent measure as we head closer to April.  Note that RSX is currently testing last week’s crash low; a new low in this ETF would signal more trouble ahead with possible spillover effect for U.S. equities.  Wall Street has always had a strange fixation on Russia.  You’d be surprised how much U.S. capital is invested in that country.  This is why trouble in Russia – be it currency-, economic- or politics-related, tends to roil U.S. equities. 


[Excerpted from the Mar. 10 issue of Momentum Strategies Report]

Saturday, March 8, 2014

An overheated (but still bullish) stock market

Our Composite Gauge is reflecting an overheated market.  This indicator combines price oscillators with put/call and insider transaction ratios which measure what insiders and professionals are doing with their money. 

Recent readings of this indicator point to increased risk for the market in the short term.  The important 10-week moving average for the Composite Gauge hasn’t yet entered bearish territory but it’s headed in that direction, as you can see in the following graph.  Historically, when the 10-week moving average sends a reading of 45 or above it’s time to exercise caution and pull in the horns.


Note also that the Rydex Ratio has reached an historically “overbought” reading. This ratio tells us that retail mutual fund investors have become inordinately bullish in recent weeks and are likely setting the stage for a near-term top.


There are, however, reasons for expecting the indices to push higher before the next correction begins.  The Dow Industrials haven’t yet caught up to the S&P and should be able to do so, based on internal momentum factors.  With the Dow Transportation Average (DJTA) recently taking a leadership role, the Industrials are expected to follow the lead of the Transports.


[Excerpted from the Mar. 5 issue of Momentum Strategies Report]

Wednesday, March 5, 2014

Japan's death struggle with deflation

To give you an idea of just how potent the deflationary phase of the 120-year Kress cycle is, look no further than Japan. 

Japan’s Nikkei stock index peaked in 1989 and the country entered a bear market and deflationary depression lasting some 20 years.  Only in the last year or so has inflation finally shown signs of life after a record-breaking amount of liquidity created by the Bank of Japan.  Shinzo Abe, the architect of Japan’s re-inflationary monetary policy, has thrown everything but the kitchen sink at the country’s economy in hopes of fighting deflation.  As it stands the efforts have been only mildly successful by historical standards; indeed, Japan’s inflation rate is up only 1.4% from last year despite a 56% year-over-year increase in the monetary base. 

As economist Ed Yardeni pointed out in a recent blog posting, Japan’s core Consumer Price Index (CPI) inflation rate has been positive for the past four months through January, when it was 0.6%.  “That’s still awfully low,” he writes, “but it beats the 55 consecutive months of negative readings from January 2009 through July 2013.

When it takes this much money creation (see chart below) just to put a floor on deflation, you know the deflationary cycles are still coming down hard.


Tuesday, March 4, 2014

Russia and the global deflation threat

Stocks came under selling pressure on Monday in the wake of renewed concerns over geopolitical instability in Eastern Europe.  An escalation of tension between Russia and the Ukraine led to a plunge in Russia’s stock market, which in turn had a spillover effect on U.S. equities….

Russia is currently the focus of Wall Street’s worries right now.  One of the better proxies for Russia’s stock market is the Market Vectors Russia ETF Trust (RSX), which lost nearly 7% in value on Monday.  RSX made a 4-year low today which underscores the political and economic troubles facing that region of the globe.  I’ll have more to say on Russia and its ally China later in tonight’s report….


Aside from the potential spillover impact of Russia’s stock market decline, an even bigger concern as we head into spring is China’s stock market.  The iShares China Large Cap ETF (FXI), our favorite China proxy, is struggling to get back above its 15-day moving average.  It’s also dangerously close to its recent low from early February.  A violation of the February low would almost certainly touch off another wave of investor concern over China’s economic outlook and would most likely be used as an excuse to sell U.S. equities (as was the case in January).  There has been an historical correlation between FXI and the S&P in recent years, with China stock weakness leading to U.S. market weakness more often than not….


Russia’s crashing stock market is in many ways similar to the tumultuous events of the summer of 1998, which witnessed an outbreak of deflationary pressure in commodities.  It began early that year with weakness in Asian economies and was accelerated by the Russian ruble crisis.  By the summer of ’98 those troubles were brought to bear on the U.S. financial market.  In only a matter of weeks, a record high in the Dow was transformed into the shortest bear market on record – a 22% plunge in the S&P over a period of just a few weeks.  Of course the bear market bottomed in October and by year’s end the major U.S. indices were heading back toward their old highs.  But the lesson learned in that event is that deflation-driven bear markets can occur swiftly and suddenly, even when everything looks rosy.  Keep in mind also that the U.S. economy was experiencing a powerful bull market in its own right at that time, which reminds us that the state of the economy can’t be used as a leading indicator when it comes to the stock market.

The 1998 experience, and more recently the Russian crisis, also reminds us how swiftly deflationary undercurrents in the global economy can lead to major trouble.  It pays to keep on your toes during the final year of the long-term deflationary cycle, and stock picking and market timing are absolutely essential.  A good money management strategy (i.e. a stop-loss discipline) is also a must in the event of a rapid reversal of trend. 

[Excerpted from the Mar. 3 issue of MomentumStrategies Report.]

Saturday, March 1, 2014

Is deflation a red herring?

Question: “What if the deflation scare is a big chimera with the purpose to justify money printing (i.e. social policy/wealth transference)?  No fear of deflation = no QE for the last several years.  No QE = no $$$ bilking of middle class in favor of corporate borrowing and Wall Street, OTC derivatives buffer.  The more I learned between the lines of heeding Faber and Jim Grant has led me to this conclusion.”

Answer: I wouldn't say the threat of deflation is intense right now, and it it's certainly not as strong as it was 2-3 years ago.  I think it's safe to say the Fed has pretty much beaten back the worst part of the long-wave deflation threat.  

I also don't think the deflation threat is chimerical.  Consider that it took a record amount of money creation to merely hold the line and put a floor under prices.  To me deflation has been the prevailing undercurrent since at least 2000.  If that wasn't so wouldn't we have seen rising bond yields over the last 14 years instead of record lows?  And wouldn't we be seeing runaway rising commodity and retail prices by now given all the money creation?  As it is, inflation is completely in check and according to central bankers dangerously low.

To me the final proof in the pudding will be what happens starting next year when a new long-term inflationary cycle kicks off.  I wonder just how fast all the bank-sidelined money will come out of hiding.  I think we have an exciting next few years ahead of us to say the least!