Tuesday, September 30, 2014

NYSE internals need improvement

Looking just below the stock market’s surface we can see that there is still much need of improvement before the next immediate-term buy signal is confirmed.  The NYSE advance-decline (A-D) line is one of the most basic, yet reliable, methods for discerning market breadth.  Despite the new highs in the Dow and the SPX, the A-D line still hasn’t confirmed the breakout in the large cap stocks.  As you can see in the following graph, the A-D line is lagging appreciably and should ideally reverse its downward slope before we get the next all-clear signal.


Another sign that there are volatile currents directly beneath the surface of the market is seen in the fact that the number of new 52-week lows has been excessive in the last couple of weeks.  Considering that a major longer-term series of Kress cycles are bottoming right now, perhaps we’ll see that number diminish in October.  If this happens it would in fact be a strong indication that the cycle has bottomed and that the market’s internal condition is improving.  For now, though, the fact that there are well above 40 new highs each day is a warning signal that the market isn’t as strong as it should be internally.

Before we can turn bullish we need to see improvement in the following areas: 1.) NYSE new 52-week highs and lows; 2.) NYSE internal momentum (HILMO); and 3.) the NYSE advance-decline (A-D) line. 

Tuesday, September 16, 2014

Can gold finally recover?

Gold recently fell to its lowest level in seven-and-a-half months as the dollar rose to a 14-month high.  Easing tensions in Ukraine and the Middle East also acted as a drag on gold and silver prices.  Investors have been asking the obvious question as to whether gold can recover from here and if a bottom of at least short-term duration is imminent?

Dollar strength has been especially hard on the precious metals of late.  Commodity prices in general have been beaten up in recent weeks by the surging U.S. dollar index, as sagging gold and silver prices attest. 


Both the U.S. dollar and commodity prices in general are largely determined by the relative strength of the U.S. economy.  With the economic recovery now in its fifth year, investors (especially foreign ones) are increasingly attracted to the U.S. as a safe haven.  Economic weakness in the euro zone has galvanized a flow of “hot” foreign money to the U.S. dollar, further bolstering the dollar while at the same time depressing commodity prices.

Along with a strong dollar, another reason for the recent weakness in the gold ETFs has been a curious plunge in the level of short interest.  For instance, the iShares Gold Trust (IAU) was the target of a large decline in short interest during the month of August despite a weak price trend. 

As of August 15th, IAU short interest totaled 1.19 million shares, which represents a decline of 48 percent from the July 31 total of 2.29 million shares, according to Stock Ratings Network.com.  Based on an average trading volume of 2.19 million shares, the days-to-cover ratio is currently 0.6 days.

Meanwhile ETF holdings for gold have continued to shrink with preliminary data for August revealing an outflow of 11 tons and flows in September have started the month off on a negative note at nine tons.

Earlier we examined the Market Vectors Russia ETF (RSX) for signs of a technical breakdown in Russia’s stock market.  A plunge in the RSX below the low from early August would suggest turmoil ahead for Russia on the Ukraine front, which in turn would be a major catalyst for gold bulls to charge.  Lately, however, RSX has remained well above the August bottom as the cease-fire talk between Ukraine and Russia has gained momentum.  As you can see in the following chart, RSX is now well above its August low of 23.00 and has bought itself at least a temporary reprieve.  In turn, gold and silver have suffered as the safe haven trade unwinds.


More than perhaps any other factor, gold has been at the mercy of the macro environment, as Barclays recently observed.  News from around the world hasn’t done the gold price any favors lately as the yellow metal continues to search for a much-needed fear catalyst. 

The December gold futures price has under-extended from the 30-day moving average by nearly 4 percent as of last week.  This is significant since a long-term research history of gold shows that whenever price extends by approximately 4 percent +/- above or below the 30-day MA, a technical reversal usually follows shortly thereafter.  Gold is technically oversold on a short-term basis and is therefore vulnerable to a relief rally in the upcoming days.  The extent and magnitude of the next relief rally, however, will depend in large measure on either a large short interest (which apparently doesn’t exist right now) or else buying interest among institutions and hedge funds looking for bargains. 

Wednesday, September 10, 2014

Will Europe's woes hurt the U.S. economy?

The U.S. economy has so far shown remarkable resilience in the face of several roadblocks year.   It has shrugged off the threat of wars in Ukraine and the Middle East, has ignored the tapering of QE, and has been generally unfazed by every other obstacle in its path, whether real or imagined.  Now, however, another threat looms in the horizon and poses a much bigger threat than previous challenges. 

Europe’s economic slowdown has weighed on the global economic outlook all year.  More recently it looks like several countries in the euro zone may even be headed into deflation.  Investors worry that deflation in Europe could spill over onto U.S. shores and ruin what has been an impressive recovery up until now. 

One reason for Europe’s lagging performance is the size and scope of its welfare state.   Economist Ed Yardeni observes that in Europe, “There are too many government regulations and regulators, and not enough startups and entrepreneurs.  Labor markets remain too rigid.”  He also points out that Europe’s bankers aren’t lending, while capital markets remain “relatively limited” sources of capital.  The region is also highly dependent on Russian gas, and, unlike the U.S. has made no effort at developing domestic sources of energy. 

While credit is plentiful in the U.S., it remains much tighter in the euro zone.  According to Yardeni, over the past 12 months through May, short-term business credit rose to a record-high $2.0 trillion in mid-August in the U.S.  In the euro zone by contrast, bank credit is down 2.2% over the past 12 months through June. 

It seems counterintuitive that there could be so much economic weakness in the euro zone even as the U.S. experiences a strengthening economy.  France is experiencing economic stagnation while Italy is back in recession.  Even Germany’s mighty economy shrank in the second quarter, according to a Businessweek report.  Why?  The primary culprit is the fiscal austerity measures enacted by several European governments in the wake of the financial crisis a few years ago.  While the U.S. evaded a major deflationary scenario through the Federal Reserve’s ultra-easy monetary strategy, policy makers in Europe took the hard road of fiscal belt tightening.  Those chickens are now coming home to roost, as several European countries have discovered to their chagrin. 

Many economists now recognize the need for Europe to reject the failed austerity policies of recent years and replace them with an aggressive monetary policy.  European Central Bank president Mario Draghi has gone on record stating that the ECB stands ready to do “whatever it takes” to buoy the euro zone economy.  Some observers have urged the ECB to take an even more aggressive stance in combating the lingering effects of the deflationary crisis years. 

Until Europe’s structural problems are addressed, what could lift the region from its current quagmire?  Margaret Carlson writing in Businessweek provides the answer: “Europe needs quantitative easing of the kind the U.S. Federal Reserve has used to good effect – that is, bond purchases financed with newly created money.  Forthright action can’t wait any longer.”  Many analysts would disagree with this assessment on a visceral level, but there can be no denying the need for serious monetary policy action in Europe.  If the euro zone is to escape the negative effects of misguided austerity, central bank intervention may be its best, and certainly swiftest, bet for dodging deflation.

In the meantime, foreign investors are moving to the dollar as the U.S. has emerged as the world’s premier safe-haven economy.  Below is a chart of the PowerShares U.S. Dollar Bullish Fund (UUP), a proxy for the dollar index.  UUP has had an explosive last two weeks and stands at a new new 52-week high – the first one in a long while. 


The strength in the dollar index this summer has been mainly a function of the bottoming deflationary long-term cycle.  In other words, investors are increasing their cash holdings as a cushion against potential volatility in equities, as well 
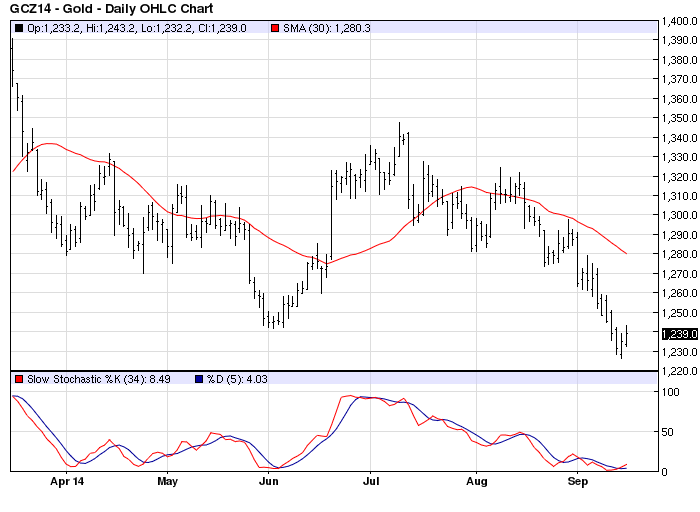
as geopolitical and global economic uncertainty, especially in Europe.  Initially, this fear of the unknown worked in favor of the gold price but at this point it appears that the dollar trade is simply a hedge against the unknown rather than a major bet against the financial market.  This incidentally explains why gold hasn’t benefited from investor psychology in recent weeks.

Returning to the question posed in our headline, will Europe’s woes hurt the U.S. economy?  Not likely.  With a new long-term inflationary cycle kicking off by October, the U.S. should see the deflationary undercurrents of the last decade steadily shrink.  Europe will have a chance at emerging from its deflation conundrum, but only if its leaders can agree to abandon the disastrous austerity policies of recent years and loosen bank lending.  The U.S. has proven to be relatively immune from overseas turmoil this year, a sign of a strengthening economy and financial market outlook.  This growing strength should serve us well in the coming year regardless of what happens in Europe.

Friday, September 5, 2014

The coming trading range breakout

Although you wouldn’t know it by looking at the NASDAQ, this year has been a tough one for many investors.  The relative lack of volatility, combined with the underperformance of small cap stocks, has kept many portfolios unchanged for the year to date.

To give you an idea of what 2014 has been like for some investors, checkout the following graph of the Russell 2000 Small Cap Index (RUT).  Clearly, the lateral trading range action of small cap stocks, which comprise a substantial portion of many portfolios, has been a frustrating experience.


It’s not just small cap investors that are feeling glum, however.  Some of the leading blue chip retail and NASDAQ listed stocks have been stuck in a trading range for most of the year.  In fact, some of the biggest retail and delivery service stocks have been range-bound for months.  Retail and delivery are of course critical components of the U.S. economy; the relative lack of a defined trend in many of the leading retail stocks is an indicator of a lack of strong consumer spending.

The New Economy Index (NEI), which measures the health of the U.S. retail economy, is reflecting the lack of direction among the most important retail stocks as well as the lack of strong demand from consumers.


After reaching a peak at the start of 2014, the NEI turned down sharply and commenced a multi-month decline which anticipated the big drop in first quarter GDP.  Since then the NEI has reversed its decline but has spent most of the summer stuck in a lateral range, as you can see here.  The NEI is back above its key 12-week and 20-week moving averages but hasn’t yet broke out above its trading range ceiling.  This implies that consumers are holding back on making large-scale purchases as they are uncertain over the durability of the recovery.

Three of the biggest components of the NEI are Amazon (AMZN), Ebay (EBAY), and Wal-Mart (WMT).  Each of these three stocks has been stuck in a trading range for most of the year.  In their own unique way, each company represents a huge segment of the U.S. economy.  Amazon is the leading online retailer, Ebay is a leading marketplace for many independent business owners, and Wal-Mart is the nation’s largest employer.  The stock price action of each is a reflection of the uncertainty of the U.S. consumer over the last several months.  Much of this uncertainty originates from the withdrawal of central bank monetary stimulus this year.

Another reason for both investor and consumer uncertainty is apprehension over the strength of the recovery.  After years of low employment, many Americans have finally found jobs but worry about keeping them.  In short, the consumer confidence that characterizes a fully mature economic boom isn’t there yet.  Until it returns consumers will continue to be cautious.

The fact that the 10-year cycle is bottoming this year has also contributed to the “go nowhere” nature of many segments of the market.  Once the cycle has completely bottomed this fall, however, we should finally see the beginnings of a trading range breakout – a breakout that will be fully realized in 2015 once a new long-term cycle is underway.  

Wednesday, September 3, 2014

A new 10-year cycle begins soon

Among the components of the 60-year economic super cycle due to bottom this fall is the 10-year cycle.  It is this cycle which is the core component of the super cycle and is responsible for this year’s financial market behavior.  The upcoming bottom of this cycle, followed by the commencement of a new 10-year cycle, will also herald a major opportunity for investors in the coming 1-2 years.

The 10-year cycle is unique among the Kress cycles in that it’s one of the few cycles whose peak is not a separate cycle.  When other cycles in the Kress series peak, the half-cycle component forms a distinctive cycle by itself.  For example, when the 4-year cycle peaks the 2-year cycle bottoms simultaneously; and when the 12-year cycle peaks the 6-year cycle bottoms.  Since there is no 5-year cycle in Kress cycle theory, the 10-year cycle peak is a true peak.

Another unique aspect of the 10-year cycle is that it’s the only one of the twelve yearly cycles that bottoms at the same time each decade, namely in the fourth quarter of year four.  This is the reason for the “Year Five Phenomenon” which sees the stock market rally in every fifth year of each decade.  The lifting of the 10-year cycle downside pressure at the end of year four creates a major lift for equity prices during the year that follows.

In the 10-year cycles of the past two decades the cycle has been relatively benign.  This normally happens when bull market conditions are prevalent.  Only when a bear market is underway, as in 1974, does the 10-year cycle bottom emphatically.  The last two 10-year cycle bottom years, in 1994 and 2004, saw lateral trading ranges develop in the Dow and S&P for much of the year prior to the cycle bottom.  After the cycle bottomed in October ’94 and October ’04, the indices broke out of their ranges and went on to higher levels as a new 10-year up cycle kicked off.


The “hard down” phase of the 10-year cycle in 2014 has produced a lateral trading range in the Russell 2000 Small Cap Index (RUT).  In the Dow, however, the influence of the 10-year down cycle has been much more benign and the end result has been an upward-sloping trading range for the Dow (see chart below).  The implication behind this pattern is that a secular bull market is well underway.  Accordingly, the upcoming cycle bottom will likely produce higher stock prices in 2015 as a new 10-year cycle will act as a favorable tail-wind for stocks (instead of an unfavorable head-wind). 


As previously mentioned, the 10-year cycle bottom will serve as a catalyst for the famous “Year Five Phenomenon” in 2015.  This is one of the facets of the 10-year cycles that is worth delving into, namely the tendency for the year following the 10-year cycle bottom to be a stellar one for stock market investors.  Since the 10-year cycle always bottoms around the start of the fourth quarter of the fourth year of the decade, the fifth year of the decade is the year that typically gets a major boost from the newly formed 10-year up-cycle.  The 10-year cycle then peaks around the start of the fourth quarter of the ninth year of the decade.  Thus the years X-5 and X-9 of the decade nearly always see impressive gains made in equity prices. 

In his book, The Right Stock at the Right Time (John Wiley & Sons, 2003), author and trader Larry Williams made the following observation about the fifth year of the decade:

“What we see is that in 11 out of 11 times the fifth year in the decade produced a rally or a market-up move, making it the strongest year in the 10-year pattern….Without a doubt the fifth years of the decades have been where the bulk of wealth has been made.  [Yale Hirsch’s] work showed a total gain of 254 percent in the five years…”  Clearly, there is money to be made in 2015 with the “Year Five Phenomenon” at work.

Once the 10-year cycle bottom is in the rearview mirror, we should see some important changes taking shape.  A major reason for the sluggish economic recovery until now has been the head-winds created by the long-term cycle.  With a brand new cycle underway starting in October, 2015 should be a breakout year for the U.S. economy.  Consumer spending will increase as the momentum behind the recovery gets a huge push from the newly formed cycle, as will business investment spending. 

Equities should also post yet another positive year as the “Year Five Phenomenon” kicks in thanks to the 10-year cycle bottom.  Watch for small investors to start coming off the sidelines next year.  They’ll put more of their money into stocks as they slowly recognize the reality of the secular bull market.  Commodities should also benefit from the cycle bottom as investors begin to minimize their heavy holdings of cash and Treasury.

With the 10-year cycle bottom only a few weeks away, the exciting opportunities of 2015 and beyond should make the uncertainty of recent years more than worth the wait.