Traders World, the leading magazine on Gann, Elliott Wave and technical analysis, has published an article by yours truly on the topic of moving averages. In it I explain the basics of some of my trading techniques involving harmonic moving averages based on Kress cycle time frames. Traders World issue #61 is now in circulation and you can view the article (on page 113) free by visiting the following link:

Friday, November 6, 2015


Wednesday, November 4, 2015
The bear indicator never lies
In
the September 10 column entitled, “The bear makes a welcome return”, we
discussed the return of the infamous bear image on the front cover of several
news magazines and newspapers. The most
conspicuous example of the bear could be seen on the front cover of Businessweek magazine, shown below.

From
a contrarian’s perspective, this was a most welcome return for it strongly
suggested that the bottom would soon be in for the stock market after the
August decline. As I observed, “From a contrarian standpoint it doesn’t
get any more emphatic than this.” Since
then the major indices have rallied off their lows with some even making token
new highs (e.g. the NASDAQ 100). I’ve
never heard of a manifestation of the bear cover indicator failing to mark a
decisive market bottom, and this time proved no exception.
Now that the Dow Industrials and the S&P
500 index have rallied back to the February-July resistance zones, should we
expect a resumption of the selling pressure that plagued the market this
summer? Or should we rather expect a
period of consolidation (i.e. backing and filling) and eventually a breakout to
new highs? As always, the answer to that
question will be answered by the market itself but the current weight of
evidence does provide us a meaningful clue as to the most likely outcome.
Before
we look at the evidence, it’s worth making an observation about the previous
sell-off. What happened to the stock
market over the three days between August 20-24 qualified as a classic selling
panic, as opposed to a fundamentally-driven crash or credit episode. This distinction is important, for if true it
will make the difference between entering a bear market in 2016 and continuing
with the bull market that began over six years ago.
A
market panic is catalyzed by an adverse and extreme reaction to a news
event. In the August sell-off it was the
currency devaluation in China that panicked investors into selling. One thing that history consistently has shown
is that true selling panics are usually retraced in short order once the fear
subsides, i.e. usually within a couple of months. The less time it takes for the major indices
to recover their losses, the less likely the selling was fundamentally driven. Hence, a true selling panic isn’t typically
the precursor of an imminent bear market.
It’s also worth noting that the market’s present internal
condition is virtually in complete contrast to what it was earlier this summer
heading into the August panic. Prior to
the summer swoon, the market’s extremely weak breadth could be seen on a daily
basis for weeks on end. From June onward
the number of NYSE stocks making new 52-week lows each day was extremely
elevated and showed that the market wasn’t internally healthy. Moreover, this showed up in the NYSE internal
momentum indicators (which are based on the new 52-week highs and lows). Most of those indicators were in decline as I
mentioned earlier this summer.
Since the August bottom, the situation has reversed. The number of new 52-week lows has been
drying up since September and have numbered less than 40 for most days since
Oct. 5. The NYSE internal momentum
indicators are now mostly in a rising pattern as opposed to the declining
pattern before the August crash. Below
is a chart showing the six major component of the Hi-Lo Momentum (HILMO)
index. Only the longer-term component
(orange line) is still in decline; the others are either rising or bottoming,
in the case of the dominant interim indicator (blue line at bottom).

These indicators are very important because they show the stock
market’s near-term path of least resistance.
There is at least one fly still in the ointment, namely the longer-term
internal momentum indicator which is still declining, as already mentioned. But all the other indicators – short-term and
intermediate-term – are rising. This
implies that the bulls currently have the advantage and that the heavy internal
selling pressure which characterized the stock market this spring and summer is
not an issue right now. This doesn’t
preclude another (potentially sharp) pullback between now and year’s end, but
the market’s main uptrend should remain intact.
Also worth mentioning is
that the New Economy Index (NEI), our in-house measure of how strong or weak
U.S. retail spending is, hit a new all-time high last Friday, Oct. 30. Although business owners remain worried over
growth prospects, mainly because of overseas woes, consumers don’t seem the
least bit concerned. They just keep
spending as the NEI chart suggests (below).
What’s more, we’re about to enter the critical holiday season when
retail sales typically hit their highest levels.

After a major decline in
the stock market it always pays to monitor the sectors and industry groups for
signs of relative strength. When, for
example, the Dow Jones Industrial Average makes a series of lower lows during
the final stage of a decline and certain individual stocks make higher lows,
that’s a tip-off that informed buying is likely taking place. When the market turns up again and these
individual stocks continue leading the market, that confirms it. At the bottom of the August panic, the
industry groups which showed the greatest resilience to the decline were water,
defense, and broadline retail stocks along with toy companies.
Among Dow Jones
industries currently showing exceptional relative strength are: Broadline
Retailers (DJUSRB), Business Training and Employment (DJUSBE), Consumer Finance
(DJUSSF), Defense (DJUSDN), Leisure Goods (DJUSLE), Restaurants and Bars
(DJUSRU), Software (DJUSSW), Toys (DJUSTY), and Water (DJUSWU). This group of industry leaders is very much
in keeping with the bullish consumer spending patterns we’ve seen reflected in
the New Economy Index lately.

There are, however, some
industries that are conspicuous laggards which are close to their yearly
lows. If these industry groups don’t
improve soon it could pose a problem at some point in 2016. Not surprisingly, most of them are commodity
and industry related and were heavily impacted by this year’s global economic
slowdown. They aren’t likely to a pose a
problem for the balance of 2015, however, especially if they remain within
their 2-month holding patterns. They
include: Aluminum (DJUSAL), Coal (DJUSCL), Healthcare Providers (DJUSHP),
Mortgage Finance (DJUSMF), Pipelines (DJUSPL), Steel (DJUSST), Railroads
(DJUSRR), and Recreational Products (DJUSRP).
If commodities can
establish a bottom in the next couple of months, particularly crude oil, then
the global economic woes of 2015 are far less likely to be of concern to the
U.S. in 2016. Moreover, if the stimulus
measures of the ECB and China continue the global economic slide will likely be
halted next year.
Wednesday, October 7, 2015
Thoughts on profligate spending
Question: I once remember you stating a
paradox of human behavior that can exist, and forgive me if I don't word it
correctly, but I believe it was around the time of when oil first starting
going over $60 a barrel [in 2005]. You
mentioned that people's habits of buying SUVs hadn't changed, and paradoxically
had increased, that during poor economic times, people sometime buy even more
expensive items or waste their money in a more egregious way - does this ring a
bell?
Answer: It sounds like an
observation I made many years ago, and yes, I still believe it still holds
true. An example of that would be the nationwide mini gambling mania
during the Great Recession of 2009-2010. You may recall that there were a
lot of “Internet cafes” creeping up everywhere in just about every city.
These were actually casinos where people could gamble at video terminals
24 hours a day, 7 days a week. Many of them were jobless and really
couldn't afford to gamble, but they did it anyway.
I think it was Bob Prechter of
Elliott Wave fame who first noted that gambling crazes are actually most common
in the early stages of bear markets/recessions. He explained that while
stock speculation is all the rage in bull markets, people also like to gamble
away their money in bear markets since the primary purpose of the bear is to
destroy capital. Plus, people still have the speculative impulse in the
early stages of a bear market, a carry-over from the previous bull market
phase. Eventually, though, if a bear lasts long enough it will destroy
even the gambling and reckless spending impulse until people are afraid of
spending money for any reason.
Tuesday, September 29, 2015
What could reverse the global market decline?
Falling
stock and commodity prices around the world are underscoring a change of
fortunes for the global economy. As the
shockwaves from Europe, China and the developing markets spreads, there is a
growing sense among investors that the U.S. might be the next casualty of the
global slowdown.
Economists
have already begun questioning what, if anything, the Federal Reserve might be
able to do to stem the financial market selling pressure. Weakness has been broad-based and is visible
in stocks, commodities as well as high-yield corporate bonds. Since the first bear market of the new
millennium, the Fed has played an outsized role as a stimulator of equity
markets and the economy.
Congress
has long since surrendered its sovereignty to the Fed in the way of introducing
stimulus measures (e.g. lower taxes and lifting regulatory burdens), and has
simply looked to the central bank in times of trouble. That dynamic will likely change in the years
ahead as it becomes increasingly apparent that the Fed’s stimulus game since
2002 has likely played itself out.
With
interest rates near zero and quantitative easing (QE) on the shelf, economists
wonder what the Fed could possibly due to reverse a major bear market if it
develops. The latest crisis which
threatens the U.S. financial system originated from abroad with problems China
and the emerging markets. Economists are
debating what impact a global economic slowdown might have on the mighty U.S.
economy and whether or not the U.S. could shrug off global weakness.
The
most reliable leading indicators of domestic economic strength, including the
Conference Board’s Leading Economic Index (LEI), show no sign of weakness in
the U.S. economy yet. In view of how
much momentum as the economy currently has, it will likely take several months
before current financial market and global economic problems show up in U.S.
economic statistics. It wouldn’t be
surprising to see consumer spending levels remain elevated in the coming months
even if the global economy continues deteriorating.

It
seems to be a mantra among classical economists that “recessions cause bear
markets.” Anyone who has spent a number
of years in the world of finance knows the falsity of this statement. There have been numerous instances of bear
markets preceding recessions, including the 2000-2002 bear market. So if the current equity market weakness
develops into a longer-term bear market it wouldn’t be the first time equities
turned sharply lower while the economy was still strong.
The
question economists should be asking is, “What happens to the economy if a bear
market in stocks and commodities persists for several months?” Is the U.S. economy strong enough to
withstand a major bear market? I don’t
think there’s any question that a major bear market would eventually have a
residual impact on economic performance.
As heavily reliant as today’s economy is on the financial market, any
prolonged downturn of stock prices is bound to have a negative spillover effect
at some point. The additional negative
impact of a weakening global economy would make it even more difficult for the
U.S. economy to remain the lone bastion of strength in a troubled world.
All
of this leads to the ultimate question as to what it will take to reverse the
broad market decline and revive the bull?
Since it started with the global market decline, I submit that the
answer will have to come from aboard. As
previously mentioned, the U.S. central bank appears to have played its
hand. Fed members, moreover, seem
resolutely clueless as to how to approach the developing crisis. One week the leading Fed members suggest an
interest rate increase is inevitable by year’s end, while the next week they
reverse their position. This
indecisiveness and lack of leadership is causing investors to lose confidence,
and that’s not helping the stock market.
As
an aside, I would point out that every incoming Fed president of the last 40
years has had to deal with a crisis of varying magnitude within the first
couple of years of their tenure. Volcker
had the inflation crisis, Greenspan had the 1987 stock market crash, Bernanke
had the credit crisis, and Yellen will most likely have the global
market/economic crisis to deal with. How
the crisis was addressed determined the efficacy of the Fed president’s
subsequent tenure. While it’s too early
to tell, it’s beginning to look like Yellen may not be up to the task of
handling the crisis with the firm resolution it requires.
A
reversal of the global market decline would likely require a decisive and
coordinated response among the world’s major central banks to truly do
“whatever it takes” to revive global growth.
Unlike the famous platitude of ECB president Draghi, the leading central
banks will have to aggressively loosen monetary policy without ceasing. They must avoid Japan’s recent mistake of
stimulating monetary policy, which proved effective, then undermining that
policy by raising taxes.
The
mistakes of Europe in recent years in the way of pursuing austerity policies
will also have to be steadfastly avoided.
Brazil has seemingly gone down this road after its socialist government
proposed a package of drastic austerity measures. Brazil is in deep recession due to the global
collapse in commodities prices and is desperately trying to revive its
economy. Unfortunately, the country’s
leadership is repeating a critical blunder made by many European nations in
recent years. It’s unlikely the outcome
will be any different.
The
alternative to a coordinately global monetary and fiscal policy response would
be a laissez faire approach. Simply
letting events take their course and allowing prices to seek their natural
levels, while resisting the temptation to raise taxes or impose austerity,
would probably be best for the long-term health of the economy. It would probably take several years before
the economy’s imbalances were completely rectified, however, and it’s unlikely
that policymakers have the foresight or patience to follow this approach. It would also be an admission that the
policies of the past decade were ineffective, and failure isn’t something
bureaucrats and politicians like to admit.
In
the final analysis, the most likely policy response will involve a heavy
commitment of liquidity and lower interest rates among the world’s major
central bankers. The sooner a
coordinated loose money policy is initiated, the less damage the global economy
will suffer in the near term. And while
it’s true that a global QE would be tantamount to kicking the proverbial debt
can down the road, can kicking as an economic policy has served the U.S. well
for many decades. It’s not the most
preferred policy, but it has proven effective as long as there’s enough road to
kick it down.
Tuesday, September 22, 2015
Are we in a bear market?
A
client writes: “Thanks as always for being our jury, Clif, and weighing the
evidence. As prosecuting attorney for
the Bears, I wish to point out some prima facie evidence of past bear markets and
past vicious corrections. Bad news
revealed was causal identification for a bottom (LTCM/Russia), while the lack
of bad news identified a bear market. Unless the attorney for the Bulls can produce some
very bad news very fast, this prosecution will rest.”
My answer: I
agree that major bottoms should ideally be accompanied by bad news, or by some
catastrophic event. One thing that bothered me about the late August low
was that at no time this summer did the percentage of AAII bears exceed 41%,
and that was way back in July. A major low should see somewhere in the
neighborhood of at least 50% bears or more (preferably more). It’s almost as if individual investors
are still too complacent.
And
yes, I agree that the news could, and probably should, be a lot worse (China
notwithstanding). At the very least we can say that the market’s
intermediate-term trend is bearish. This is confirmed by the interim
trend indicator as well as by the NYSE intermediate-term internal momentum
indicators.
One
could even make a preliminary case that the long-term trend has turned bearish,
if you look at the 200-day MA and some other indicators. I believe in
giving a secular bull market every last benefit of the doubt, however, so I
haven't officially pulled in my horns on the longer-term trend. I may be
forced to do so, though, if things don’t improve in October.
Thursday, September 17, 2015
Halloween came early this year on Wall Street
The
Federal Reserve guessing game ended Thursday after the FOMC made its decision
on interest rate policy. The Fed left
rates unchanged in a tip of the hat to investors who felt the economy was
vulnerable to overseas weakness. This
was what most on Wall Street wanted, although there was a sharp intraday
reversal after the announcement (apparently a case of buy the rumor, sell the
news).
In
last week’s commentary I emphasized that there was a built-in Wall of Worry for
stocks to climb based on the recent spike in bearish investor sentiment. There’s still a lot of short interest in the
market which could be used to fuel a short covering rally, especially now that
Fed interest rates are unchanged.
There’s no denying that equities love low interest rates, and the longer
the Fed leaves the benchmark rate unchanged the better it bodes for
investors. Whether or not it actually
helps the economy is a different story, however.
There
seems to be some contention among pundits as to whether the Fed should raise interest rates before the
year is over. The hawks maintain that
keeping rates near zero would only encourage another equity market bubble and
eventually lead to another credit crisis down the road. The doves insist that the longer the Fed
funds rate remains at or near zero, the more stimulative it will prove for the
financial market and the banking system.
My view is that bubbles occur when the Fed funds interest rate fails to
keep pace with Treasury yields. Considering
that government bond yields aren’t much higher now than they were at the depths
of the 2008 credit crash, I see no problem with keeping the Fed funds rate low
for a while longer. At the end of the
day, though, it’s up to investors to decide whether or not they like the Fed’s
policy.
Assuming
the market is ready to kick off a recovery rally, there are a couple of areas
in need of improvement. I’d like to see
some continued improvement in the market’s internal condition first and
foremost. The minimum requirement for
internal repair is a diminution of the NYSE new 52-week lows. On a positive note, the number of stocks
making new lows has diminished each day since Sept. 11. Moreover, we finally saw the first day since
Sept. 3 in which there were fewer than 40 new lows on Thursday, Sept. 17. If the new 52-week lows remain below 40 for
the next few sessions it will confirm that the market has returned to a normal,
healthier internal state.
The
NYSE Hi-Lo Momentum indicator series known as HILMO is based on the new 52-week
highs and lows and shows the stock market’s path of least resistance on a
short-, intermediate-, and longer-term basis.
The short-term directional components for HILMO are looking better than
they have in a long while but still need more improvement. You can see here that they’re trying to turn
up in sustained fashion, though. If it
continues from here it will support the bulls’ attempts at rallying the major
indices back to the pre-panic levels from early August.

Meanwhile,
the intermediate-term HILMO components are in even greater need of
reversal. Note the continued downward
trend reflected in the sub-dominant interim (blue line) and dominant interim
(red line) indicators shown below.

The
decline in the intermediate-term HILMO components shown above is consistent
with the fact that our intermediate-term trend indicator is still technically
bearish. To get a renewed
intermediate-term buy signal we need to see a majority of the six major indices
back above their 30-day and 60-day moving averages on a weekly closing basis.
Our
immediate-term (1-3 week) trend indicator has confirmed a bottom, however. All six of the major indices – the Dow, SPX,
NDX, NYA, MID and RUT – have all closed at least two days higher above their
15-day moving averages to confirm the bottom.
This technically paves the way for a relief rally. It’s worth mentioning that panic declines are
usually reversed within a couple of months once the fear that catalyzed the
sell-off has completely dissipated.
It’s
also worth mentioning that the Dow Jones Transportation Average (DJTA) has
erased most of its losses which it sustained during the “flash crash.” This has positive implications for the Dow
Industrials, shown above. Keep in mind
that the DJTA led the way lower for the Industrials heading into August. It’s constructive, from a Dow Theory
perspective, that the Transports are showing relative strength at this time.

The
NYSE Composite Index (NYA), which I consider to be the most comprehensive
measure of the U.S. stock market, has barely budged higher recently and hasn’t
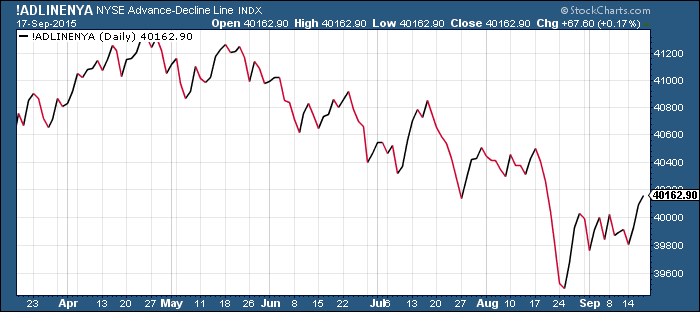
yet broke out of its 3-week consolidation pattern. By contrast, the NYSE advance-decline (A-D)
line is finally starting to show relative strength. One of the things I like to see at a market
bottom is for the A-D line to show leadership versus the NYA. This has started to happen, and if it
continues should bode well for the prospects of the NYSE Composite Index.
Thursday, September 10, 2015
The bear makes a welcome return
The
S&P 500 Index had its worst August since
2001, while the Dow’s 6.6 percent drop was its biggest since declining 15
percent in August 1998. Most investors
consider the September-October period to be the witching months for equities,
but the past month was a painful reminder to many of them just how bad August
can sometimes be.
Along those lines, Bloomberg has observed that while August ranks in the
middle among months based on share performance, it has produced some of the
worst returns of the year since 2009.
During the week ended August 12, 2011, the S&P 500 alternated
between gains and losses of at least 4 percent for four days, something never
seen in 88 years of data compiled by Bloomberg.
In 2013, the S&P 500 fell 3.1 percent in August, one of only two
months of negative returns in a year when the index surged 30 percent.
Since
the late August sell-off, there has been a constructive development underway in
terms of investor psychology. The
market’s sentiment profile has shown vast improvement since the last month
before the sell-off. The following
magazine headline from a recent issue of Bloomberg
Businessweek is a classic example of the magazine cover indicator at work.

That’s
right, a cover full of bears! From a
contrarian standpoint it doesn’t get any more emphatic than this.
Below
is another manifestation of the bear on a recent news magazine cover. The headline questions whether a bear market
is imminent, which has definite contrarian implications.

The
bear analogy can also be seen in the Sept. 7 issue of The New Yorker. Even The Economist got in on the act with a
Sept. 4 reference to China’s market decline (the alleged cause of Wall Street’s
plunge) on its front cover.


These
are the type of magazine cover that appears at, or very near, important interim
lows. While the magazine cover indicator
can’t always be used to time the exact location of the bottom, it does provide
an important “heads up” that the bottoming process has most likely begun with a
confirmed interim bottom to follow in the weeks immediately ahead.
The bigger question
confronting investors is whether the August correction was simply a one-off
event or the prelude to something much bigger? This is a question
that will undoubtedly be given much attention by analysts in the weeks
ahead. To proclaim the termination of the 2009-2015 bull market right now
would be premature in my opinion. I believe an established long-term
uptrend should be given every last benefit of the doubt to prove itself before
proclaiming its death. If the bull market is to persist beyond 2015,
however, it’s imperative that the internal condition of the stock market
relative to the new 52-week highs and lows substantially improve. Otherwise
the situation we witnessed in August will only repeat at a later date.
Market episodes like the
late August sell-off rarely occur out of a clear blue sky. The
market usually provides a preliminary warning to give wary participants a
“heads up” that something bigger could be on the horizon. For
instance, in the lead-up to the 2008 credit crash there were several early
warning signals in the stock market beginning with the February 2007 correction
and again in August that year. The preliminary warning to the recent
correction was the NYSE electronic outage in early July. NYSE
trading screeched to a halt for nearly four hours on July 8, which officials
blamed on a “technical glitch.” The event spooked investors, which was a
further sign that market psychology was vulnerable to another surprise event.
Investor fear seems to
have reached a crescendo since early September, however, and any further
erosion in fear from this point could serve as a catalyst to short covering
rallies, near term. The latest Bullish Consensus indicator (below)
has reached its lowest reading of bullish sentiment since 2013. This
is also a sign of a healthier market from a contrarian perspective.

By
far the most important ingredient needed for a major bottom and re-entry signal
is a significant contraction of the number of stocks making new 52-week lows on
the NYSE. The number one problem that
has plagued the stock market since the beginning of summer has been the
persistence of internal weakness. It’s
also what made the market vulnerable to the correction that occurred last
month. This can be seen in the fact that
on most days the number of stocks making new 52-week lows has exceeded 40,
which is the historical dividing line between a healthy and an unhealthy market
environment.
Only
once this month to date has there been fewer than 40 new lows (Sept. 3). Each day this week (Sept. 7-11) has witnessed
an expansion in the new 52-week lows, culminating with 131 new lows as of this
writing on Sept. 10. This is
unacceptably high and tells us that there is still some internal weakness
within the broad market. Moreover, this
weakness must be resolved before the market launches its next sustained rally.
Subscribe to:
Posts (Atom)