Tuesday, July 9, 2013

MSR trading performance for Q2

The second quarter of 2013 was largely profitable for most companies, although there was more stock market volatility in Q2 compared to Q1.  Q2 heralded the start of a narrowing phase for the stock market where stock selection becomes much more important than just buying an index ETF and holding. 

Following are the results of our stock/ETF trading recommendations for Q2 2013:

April 11: Bought PNM Resources (PNM) @ 23.61
April 17: Sold PNM @ 22.70 (stopped out)
April 18: Stopped out of PowerShares S&P 500 High Quality Portfolio (SPHQ) @ 17.28; bought at 17.08
April 26: Stopped out of Bristol Myers Squibb (BMY) @ 40.65; bought at 37.50
May 6: Bought Cree Inc. (CREE) @ 58.10
May 6: Bought Splunk Inc. (SPLK) @ 43.40
May 11: Took some profit in CREE @ 61.62
May 21: Took some profit in SPLK @ 46.49
June 4: Stopped out of SPLK @ 43.40
June 10: Bought Starbucks Corp. (SBUX) @ 65.66
June 24: Stopped out of CREE @ 60.00
June 24: Stopped out of SBUX @ 64.00


Monday, July 8, 2013

NEI probes an all-time high

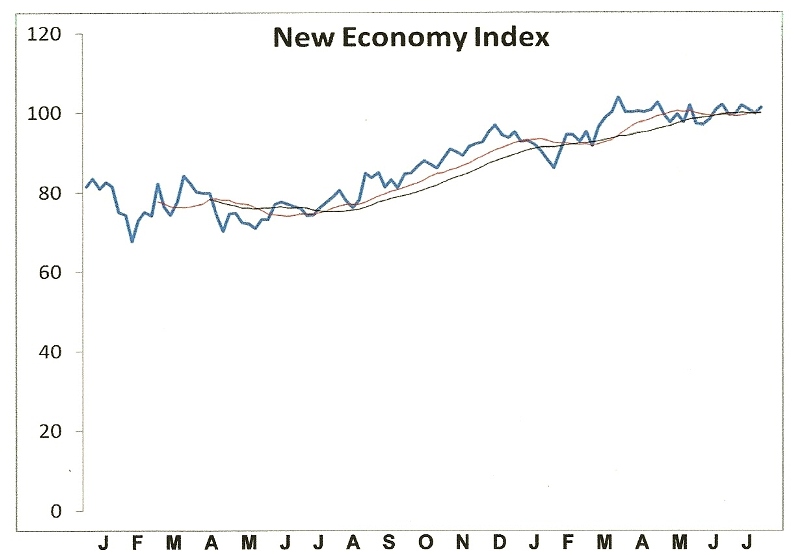
The event of the week was the (almost) new high in the New Economy Index (NEI), which is now back to its previous all-time high of 103.80.  This was the level the index peaked out at on January 25 and hasn’t been revisited until now.

The recovery in the NEI after a 5-month period of consolidation is telling the story of continued economic strength in the U.S. retail economy.  The intermediate-term uptrend for the U.S. economy thus remains intact after the index threatened to break the trend some weeks ago.  NEI hasn’t given a confirmed economic “sell” signal in over three years.


Consumer optimism is most conspicuously reflected in the trend for auto sales, which has reached a multi-year high this year.  Sales of cars, light trucks and commercial vehicles are moving at a torrid pace this summer, which can be attributed to the economic and financial market momentum from late 2012/early 2013.  Rising interest rates – or the fear of higher rates down the line – are also a likely factor in spurring all kinds of big ticket purchases, from cars to houses. 

The performance of the New Economy Index in the last few years raises a question: can the NEI be considered as a leading indicator for the stock market?  There have been some notable instances of the NEI leading the stock market, both to the upside and the downside, in recent years.  I don’t believe a correlation can be established between NEI and the market, however, as several more years of performance history are needed (the index only stretches back to 2007).  Nevertheless, since NEI is comprised of the leading consumer/retail sector stocks, a breakout to a new high in NEI this week would carry bullish implications for the broad market.

Saturday, July 6, 2013

Why bank stocks are unconcerned by higher rates

Many analysts predict that banks will be hurt by higher interest rates.  Yet the best leading indicator of banks’ future profits – financial sector stocks – aren’t showing the slightest concern by this prospect.

Indeed, judging by the performance of the Bank Index (BKX) and the Broker Dealer Index (XBD), financial institutions seem to be quite at home with the idea of higher interest rates.  This, we are told by some experts, is because higher rates allow banks to loan more money.  Insurers also generate more returns on their investment portfolios with rising rates without having to rely on premiums. 


Despite the nearly 9% jump in the Treasury Yield Index (TNX) on Friday, July 5, bank stocks were up by an average of 2.62% while broker/dealers were up 2.39%.  Both the XBD and the BKX made new 52-week highs in contrast t the S&P 500, which is still below its previous high from May.


Rising rates aren’t good for everyone, however.  Homebuilders and REITs are struggling under the weight of higher interest rates, as can be seen in the daily chart of the Dow Jones Equity REIT Index (DJR).


Yet rising rates are providing a near-term boost to home buying.  As Dr. Ed Yardeni has pointed out, homebuyer’s initial reaction to rising mortgage rates has prompted would-be home buyers to close their deals as quickly as possible. 

Could it be that the reason for the bank stock rally despite rising rates is that banks are benefiting from the short-term stimulating effect of mortgage activity?  Once this wave of closings is completed, what then can we expect from bank performance?  I would venture a guess that the bottoming 120-year cycle in 2014 will suck the wind out of banks’ sails , thus defeating the expectation of increased loan activity.

Friday, July 5, 2013

Trouble brewing in China

The real economic and financial trouble spots in the world right now, however, are to be found primarily in Asia.  On Wednesday, a report showing slowing growth in China's service sector weighed on global markets. The National Bureau of Statistics reported that China’s services PMI, a measure of activity, had fallen to a nine-month low of 53.9 in June from May’s 54.3.  Although no major media outlet will come right out and say it, China is deflating.

The single best predictor of China’s business outlook is its stock market, and this can be seen in the relentless decline of the Shanghai Composite Index shown below.  China has actually been in the throes of a bear market for four years and this can only mean its economy will experience more turbulence in the months ahead.  If you were an odds maker and wanted to lay odds on where the next major economic crisis would begin, you’d have to point to China as being the most likely candidate.


Perhaps it is fitting, as tonight’s headline suggests, that as America prepares to celebrate its independence, it can still boast of being a bastion (relatively speaking) of economic and financial market stability.  Meanwhile chaos and uncertainty are increasing in other parts of the globe.  History tells us that sooner or later the world’s troubles inevitably end up on America’s shores, as it did in 1998, 2000-2002, and 2007-2008.  But until that fateful day of reckoning comes, the U.S. remains the undisputed leader among the global powers in terms of its buoyant equity market, strong corporate sector and firm retail economy.  [Excerpted from the 7/3/13 issue of Momentum Strategies Report]

Wednesday, July 3, 2013

Is inflation a good thing?

“Is there really such a thing as too little inflation?”  That’s the question the economists at Kiplinger recently asked.  For retirees living on fixed incomes or for business owners with limited control over the prices they charge, the answer to that question is an emphatic “no!” since inflation hurts them.

Monetary policymakers, on the other hand, remain steadfast in their belief that a contained amount of inflation is actually good for the economy.  As Kiplinger points out, the Fed reasons that “Businesses won’t hire more because consumers aren’t buying enough.  Consumers would buy more today if they feared that prices would go up tomorrow.  Plus fatter paychecks for those who get cost-of-living hikes typically spur more spending (even though income in real terms, after inflation, doesn’t change).”  They point out further that for businesses that don’t make cost-of-living adjustments to wages, real labor costs would decline, prompting additional hiring and income growth. 

What the Fed’s QE3 stimulus program really amounts to is an attempt at creating inflation through artificial means.  The classical definition of inflation is an economic condition characterized by rising wages, rising prices and rising interest rates.  Inflation is a product of the 60-year long-term/long-wave economic cycle.  When the cycle is in its peak phase there is inflation.  This is due to a combination of demographic, structural and monetary variables.  The last time inflation was truly a problem for the U.S. economy was in the late ‘70s/early ‘80s. 

When the 60-year cycle is in its descending phase, especially in the final few years of the cycle, there tends to be deflation to some degree or another.  The 60-year cycle is due to bottom late next year, which explains why the Fed has been unsuccessful in creating inflation in the face of the “hard down” phase of the cycle.  Although the Fed has been unremitting in its attempt at fighting deflation, it has found that overcoming the natural forces of economic nature is an impossible task.  The best the central bank has been able to do in the face of the long-term cycle is to cushion the blow and keep deflation from overwhelming the economy.

It might be argued that inflation is not a good thing, at least not during the deflationary phase of the Kress cycle.  Artificially raising the consumer price level can actually be quite destructive when the economy’s natural tendency is toward lower prices.  It hurts even more when wages are stagnant or declining on an adjusted basis and interest rates are near record lows. 

In the final analysis, the Fed will end up doing more destruction than good with its policy of trying to create inflation.  It would do well to let nature take its course and allow the forces of the long-wave cycle to cleanse the system of the imbalances and impurities created during the last 30 or so years.  Unfortunately, this will never happen due to the interventionist nature of bureaucracy.  

Be warned that when the 60-year cycle finally bottoms, the Fed is apt to get a lot more inflation than it bargained for in the years that follow.

Tuesday, July 2, 2013

Inflation’s shot across the bow

On May 3, the bond market fired the proverbial “shot heard ‘round the world.”  Treasury yields began a two-month climb to levels not seen in almost two years.  Many analysts proclaimed the end of the 30+ year interest rate decline.   The true significance in the yield rally isn’t that the long-wave deflationary trend in interest rates is over, however.  Rather, it’s that the commencement of long-term inflation is within sight.

While the rally in Treasury yields does have longer-term significance, it’s still far too early to assume the downtrend in yields is over.  As we’re still some 15 months away from the bottom of the 120-year cycle of inflation/deflation we can only assume the downward trend in interest rates remains intact.  Additionally, as real estate analyst Robert Campbell has pointed out, “until the actions of the Fed speak otherwise, Fed policy is currently working to push mortgage rates down.”

The rally in Treasury yields, while impressive, should be put into context with the longer-term yield trend.  Here’s what the Treasury Yield Index (TNX) looks like from the vantage point of a 2-year chart.  In this relative short-term chart you can clearly see the attempt yields have made in establishing a new rising trend in relation to the steep drop in 2011-2012. 


It’s only when we examine the long-term monthly chart of TNX that the true long-term trend becomes clear.  The downtrend line that can be drawn by connecting the yield peaks from 1996 through 2011 hasn’t even been broken yet.  The interest rate downtrend is therefore presumed to be still in force.  It likely won’t be until after October 2014, when the Kress mega cycle bottoms, that we’ll finally see this downtrend broken.


What then is the ultimate significance of the sharp rally in bond yields?  The spike in yields can only be appreciated by making historical comparisons with markets that behaved in a similar fashion.  For instance, gold was in a similar long-term downtrend from 1981 through 1999 when, in the autumn of ’99, the yellow metal unexpectedly launched a vigorous rally from its long-term low of nearly $250/oz. to a high of over $330/oz. in just a few short weeks (see chart below).  This wasn’t the official beginning of gold’s long-term bull market, which would actually begin less than two years later.  It was, however, an advance warning that a major change of gold’s long-term trend was in the making. 

Comparing gold with bonds isn’t as dissimilar as some may think, for both are excellent barometers of longer-term global liquidity and inflation/deflation expectations.  Of the two, interest rates are a more important indicator of inflation and deflation, so it will be especially important to monitory the interest rate trend in the coming months as we draw closer to the 120-year cycle bottom.

The ultimate meaning behind the short-term rally in Treasury yields can only be known with certainty after the facts have become clear.  It’s still far too early to discern what those facts may be.  Based on historical examples, however, it’s probable that the yield rally is a “shot across the bow” preliminary to the beginning of a new long-term inflationary trend starting in late 2014/early 2015.  

Monday, July 1, 2013

U.S. safe from overseas deflation for now

The selling pressure which hit stocks and bonds in June left the U.S. retail economy unscathed.  

Among the individual corporate stock components of the New Economy Index (NEI), which measures the real-time strength of the economy, only Wal-Mart (WMT) took a sizable tumble in June.  Monster Worldwide (MWW), the jobs component of the NEI, also plunged last month but its stock price accounts for only a small amount of the index.

Meanwhile Amazon (AMZN), EBay (EBAY) and FedEx (FDX) – the other important components of the index – are in varying degrees of health or recovery.  The signals reflected in the stock price performance of these three stocks alone are worth a hundred conventional economic indicators of the type relied on by mainstream economists. 

The NEI reading for last week was in line with the reading of recent weeks, viz. the NEI is still holding on above its 12-week and 20-week moving averages.  The interim uptrend for the index remains intact (below), therefore we still have a confirmed “buy” signal for the U.S. economy. 


Deflationary pressure is expected to resurface as we head closer to the final “hard down” phase of the long-term Kress cycle in 2014, but for now those pressures are confined mainly to Europe and Asia and haven’t yet appeared in the U.S.  The domestic retail economy, along with the consumer spending that supports it, is still firm.