Hanging
like a millstone around the neck of the broad market has been the increasing
number of new NYSE 52-week lows. Most of these new lows are in the
interest-rate-sensitive sectors, particularly muni-bond funds and ETFs. The
rally in Treasury yields has fed into this trend and is putting some outside
pressure on equities. However, there are still just enough
pockets of strength to perhaps keep the major indices from breaking below their
longer-term moving averages. Financial sector stocks continue to
show relative strength which suggests the current internal market correction
will be relatively brief in duration.
Speaking
of long-term trend lines, the 150-day (30-week) moving average for the SPX is
about to be tested. As I mentioned in previous reports,
the 150-day MA is a critical longer-term trend line for the S&P which has
served as a pivotal reversal point for several stock market declines of the
last several years and has turned back each previous correction of the last six
months. The
150-day MA intersects the 2,071 level of the daily chart as you can see here.
The
rising trend in Treasury yields has also exerted a negative impact on some
other financial sensitive areas. Corporate bond prices have plummeted
in recent weeks as T-bond yields have rallied. I’ve
long noted the positive correlation between corporate bonds and stock markets;
a weak corporate bond market could therefore weigh on equities in the near term.
Consider
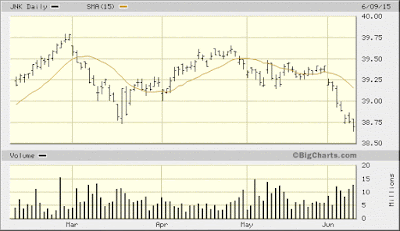
also the SPDR Barclays High Yield Bond ETF (JNK). JNK tends to lead the SPX by several weeks;
for instance, weakness in junk bonds often precedes stock market weakness while
strength in junk bonds tends to anticipate stock market rallies. The following graph compares the movements of
JNK with the SPX. Note especially the
November-December 2014 decline in JNK, which led the S&P 500 to a sharp
correction in mid-December. The
subsequence relative strength in JNK in January 2015 was a harbinger of
strength for the SPX in February.
Right
now the junk bond ETF is downward trending which sends a caution signal on the
short-term broad market outlook. Underscoring
the short-term weakness is the bigger-than-normal new 52-week lows on the
NYSE. There were 128 new highs on
Monday, which is a definite indication of internal weakness. This weakness is being reflected in the
short-term components of our NYSE Hi-Lo Momentum (HILMO) indicator shown here. As I’ve emphasized in recent reports, until
HILMO improves traders should embrace a cautious stance on stocks.
[Excerpted
from the June 8, 2015 issue of MomentumStrategies Report.]


